Who do you think you are? Unknown family members and DNA colour clustering

Reimagine Remake Replay – ‘Uncovered’ Witch Trials video
14th October 2020
Big Houses- Hidden Gems of the Causeway Coast
3rd November 2020Who do you think you are? Unknown family members and DNA colour clustering
Project Attributes
Project:
Owner:
Date:
19th October 2020
Who do you think you are?
Unknown family members and DNA colour clustering
In this project post, I wanted to look at the previously unknown family relationships that can be thrown up by DNA testing. Many of us with a good handle on our extended family tree still find surprises in our DNA matches – apparent cousins who don’t obviously fit into what we already know. Others, who may not know about one (or either) side of their family can be left feeling overwhelmed by cartloads of new, unstructured, information.
Using a colour-coded Microsoft Excel file to create visual clusters can make it easier to digest and make sense of the matches in front of you. The system outlined below was developed by Dana Leeds in 2018. It isn’t without its flaws; colour clustering, as with most DNA results, is not proof of a specific relationship. Rather, it is a clue that can be helpful in determining relationships. As long as it is seen for what it is – one more tool in the toolkit – it can be incredably useful.
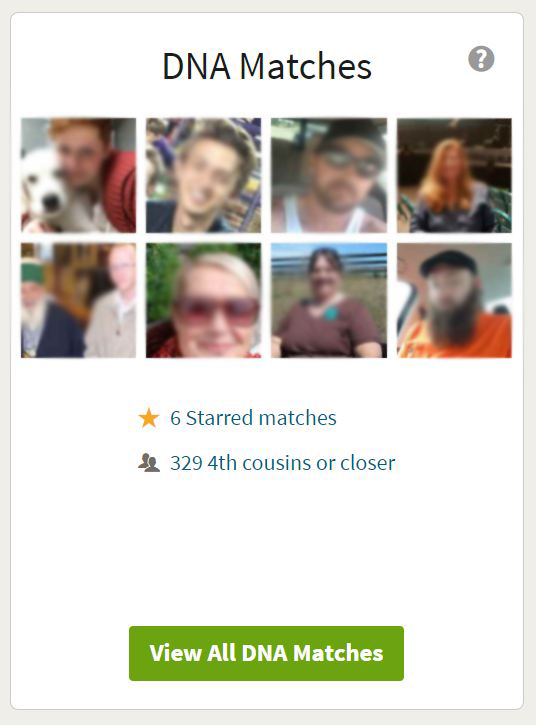
The following example, based on the Leeds Method, uses the real results of a willing participant whom we will call Laura. All surnames have been removed to protect privacy. First up, we go into Laura’s AncestryDNA account. We then click on the button to View All DNA Matches (as shown below).
This will bring up a list of all people whom AncestryDNA judge to be related to Laura due to shared genetic units known as centimorgans (cM). The higher the shared cM, the closer the relationship is likely to be.
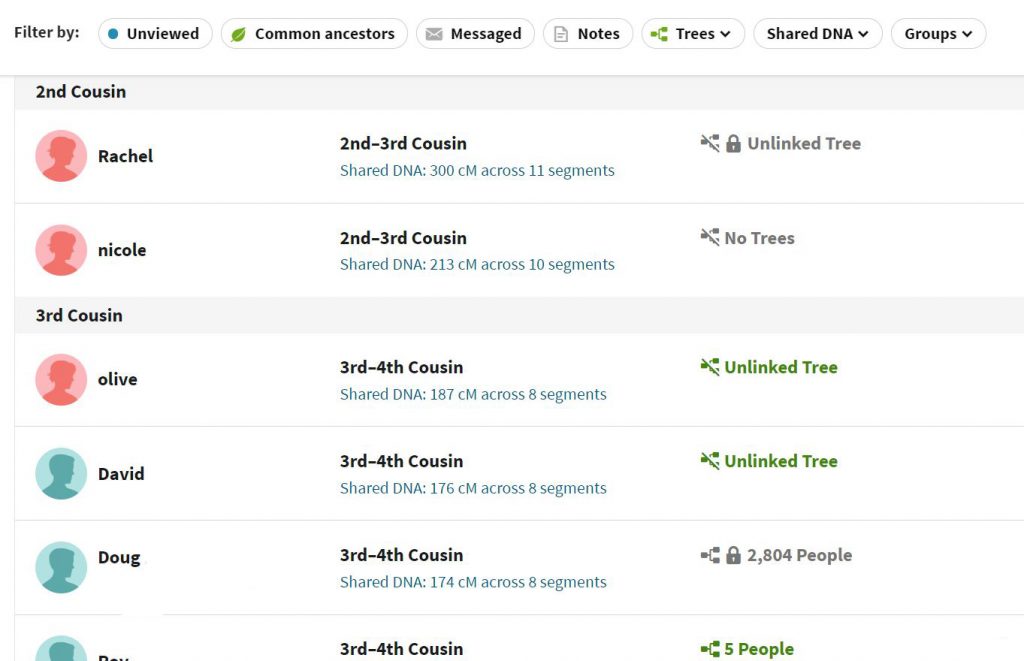
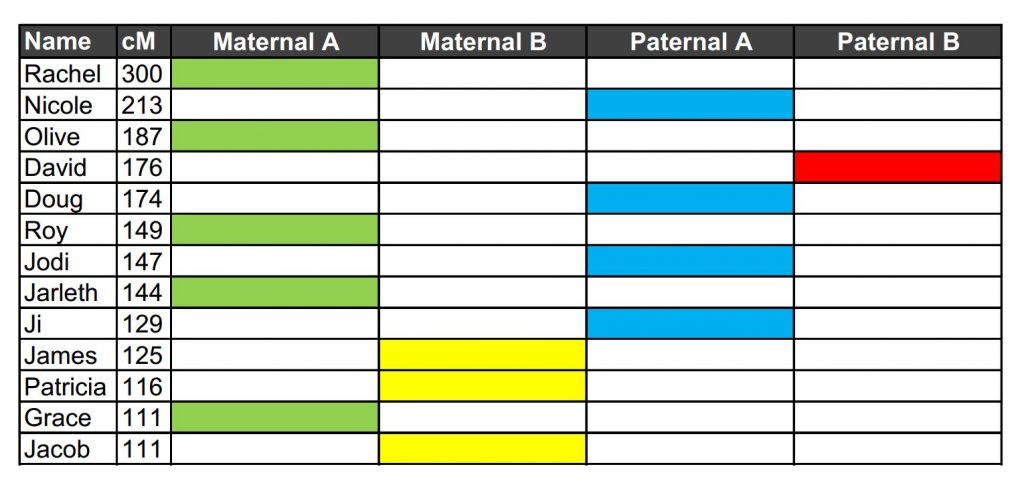
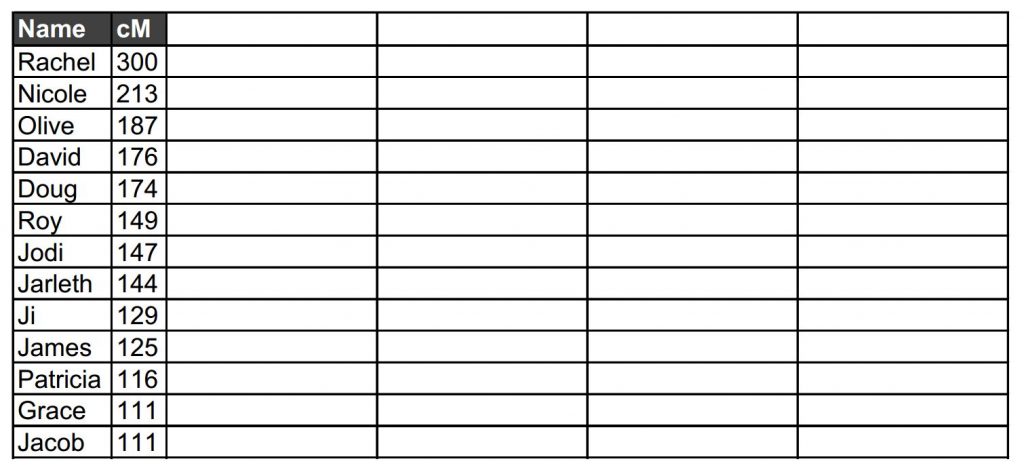
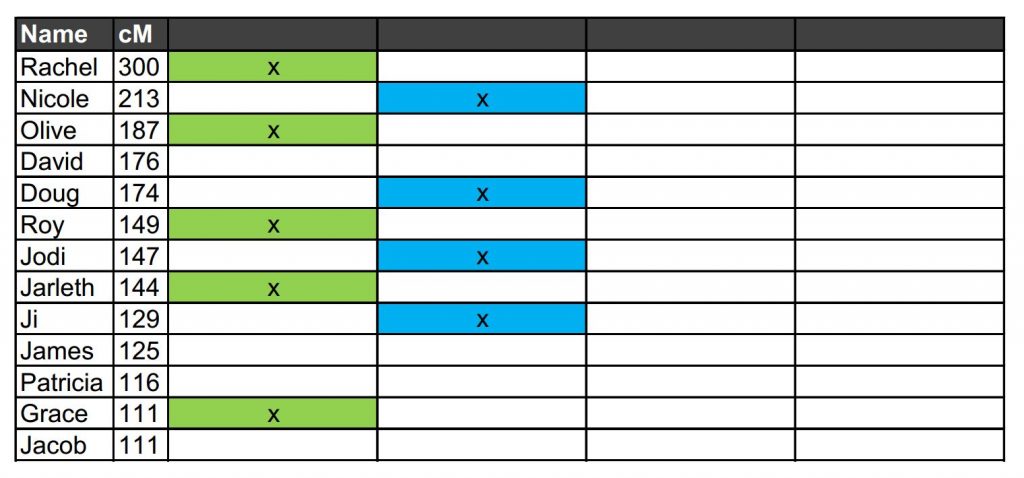
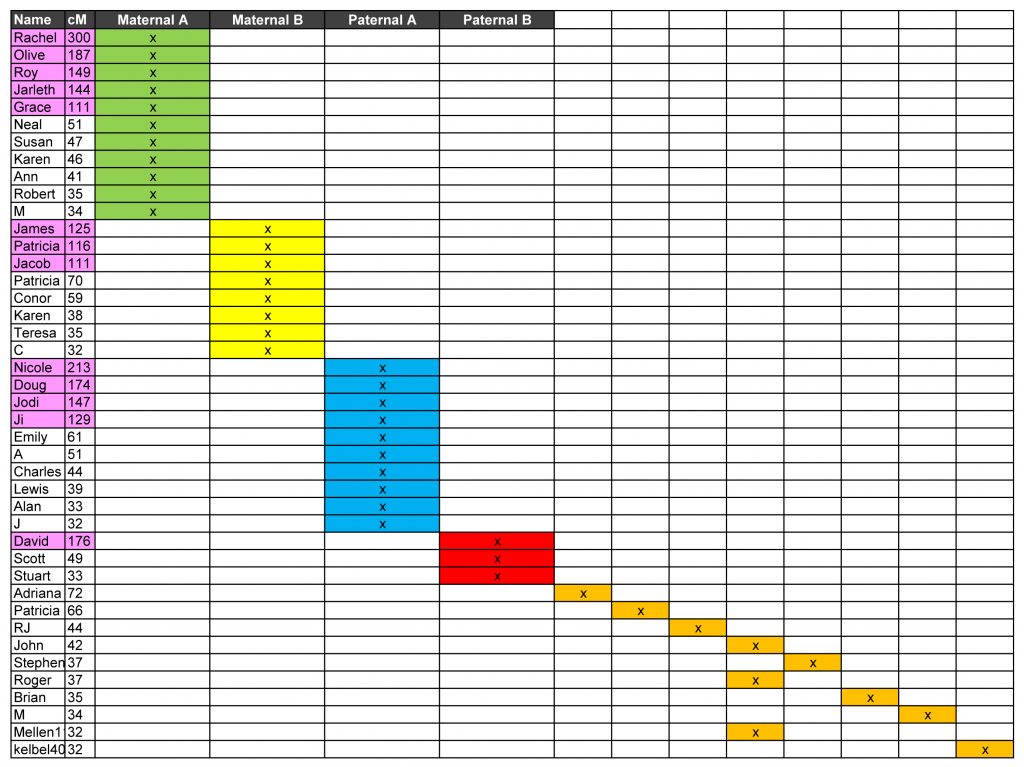
We can then make a spreadsheet in MS Excel, entering all individuals reckoned by Ancestry to be second cousins or third cousins. For Laura, Ancestry has identified 13 second and third cousins. We’ve also noted the shared cM for each person because it is good to be able to see at a glance how closly related people are likely to be. Leeds recommends leaving out any of the matches near the top who share over 400 cM. The key is to not include anyone with whom you share two grandparents (i.e. no siblings or first cousins).
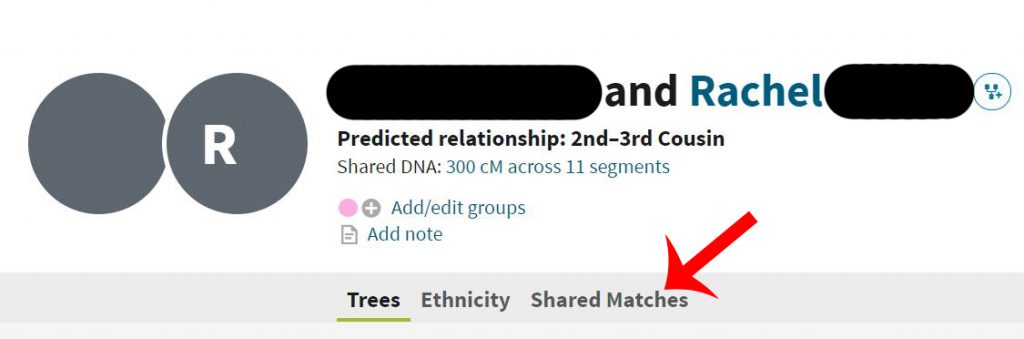
Skipping back to Ancestry, we click on the first person on the list (in this case, Rachel who shares 300cM with Laura). This will open up a screen looking at the relationship between Laura and Rachel. Click on the Shared Matches tab (indicated with the red arrow below).
This then shows all the people who share cM with both Laura and Rachel. Shared Matches indicates a shared ancestor. You may find that some cousins have lots of shared matches, while others have fewer (or none). This is merely down to whether members of that branch of the family have had their DNA tested with the same company or not.
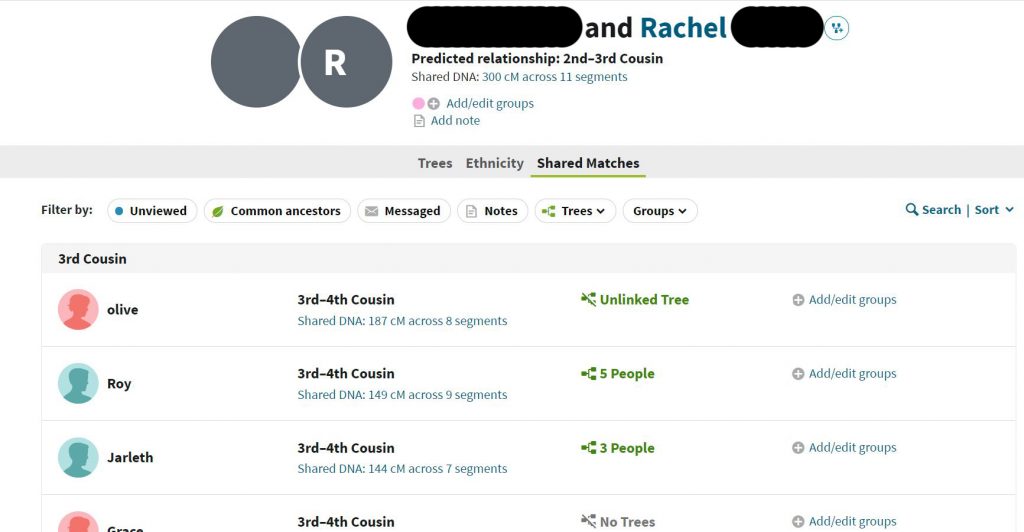
In the Excel spreadsheet, we allocate a column and a colour for Rachel and the shared ancestor. In this case I have used green. All of the people shown share cM with both Laura and Rachel form a DNA cluster (our green cluster) and therefore they all share a common ancestor.
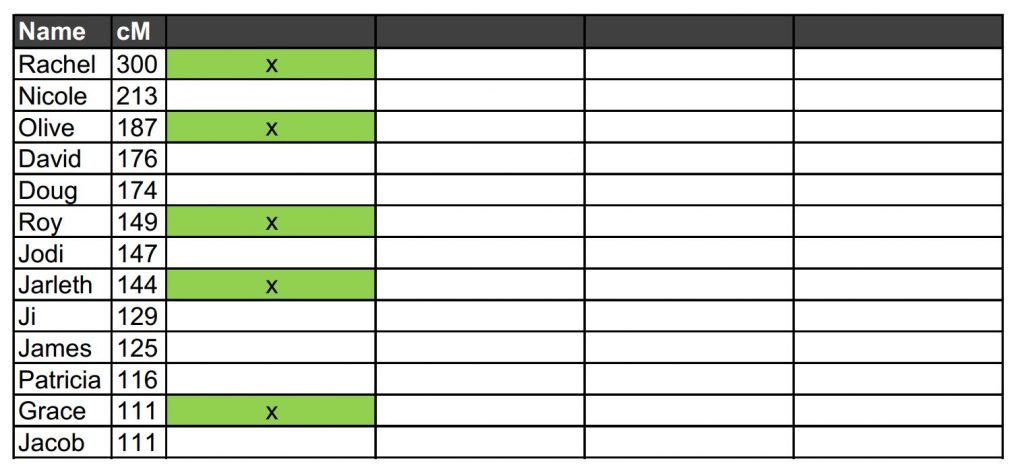
Having identified our green cluster, we move down the list to the first individual who is not part of that grouping – in our example, that would be Nicole. We click on her name in Ancestry, bring up her shared matches with Laura, and ascribe them a new column and a new colour (blue in our example below). We then repeat the process, moving on down the list of cousins identifying different DNA clusters and giving them different colours.
Continue the process until all cousins belong to at least one colour cluster. Although it didn’t happen in our example, a person could be assigned to multiple colour clusters if they share cM with more than one group of cousins. When someone is part of more than one color cluster, Leeds calls it cluster overlap.
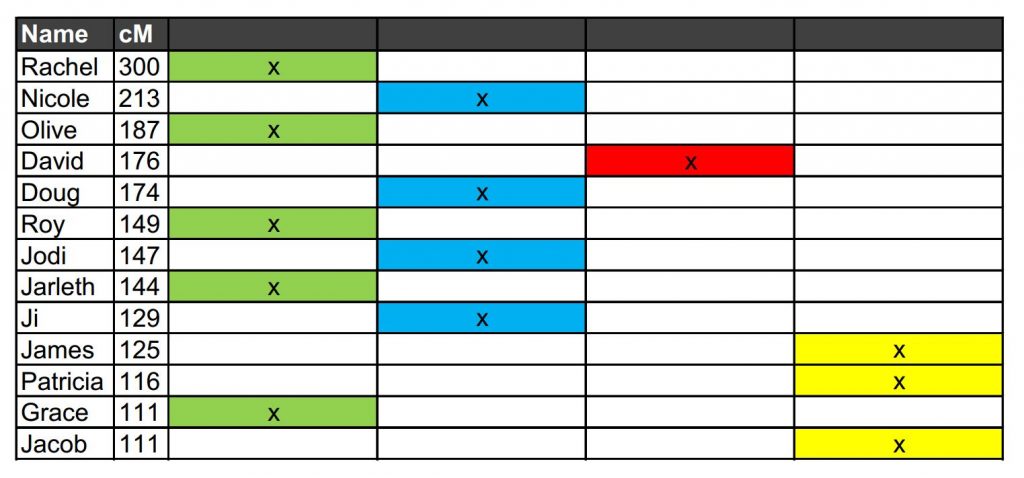
So we can now see that all of Laura’s estimated second and third cousins fall into four distinct colour clusters without any overlap. These colour clusters likely show matches to Laura’s four sets of great grandparents.
In this case, we were aware of the relationship between Laura and one of the individuals in the green cluster, and one of the individuals in the yellow cluster. Both are related to Laura through her mother’s side, one through the maternal grandfather, one through the maternal grandmother.
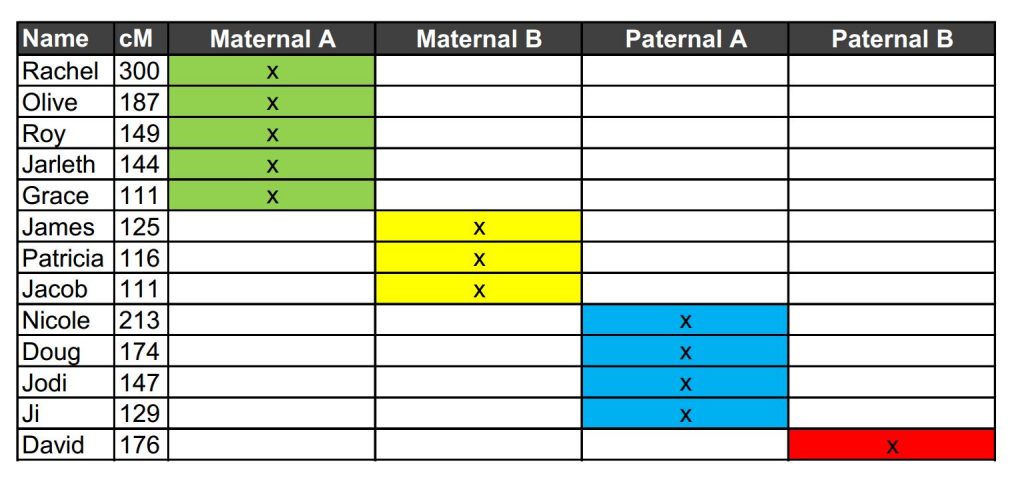
It is plausible to rearrange the clusters in such a way that we can identify which set of great grandparents the green and yellow clusters descend from (the surnames have been removed for privacy from this post and replaced by Maternal A and Maternal B). The red and blue clusters therefore likely descend from the two sets of paternal great grandparents respectively – a side of the family Laura knows little about.
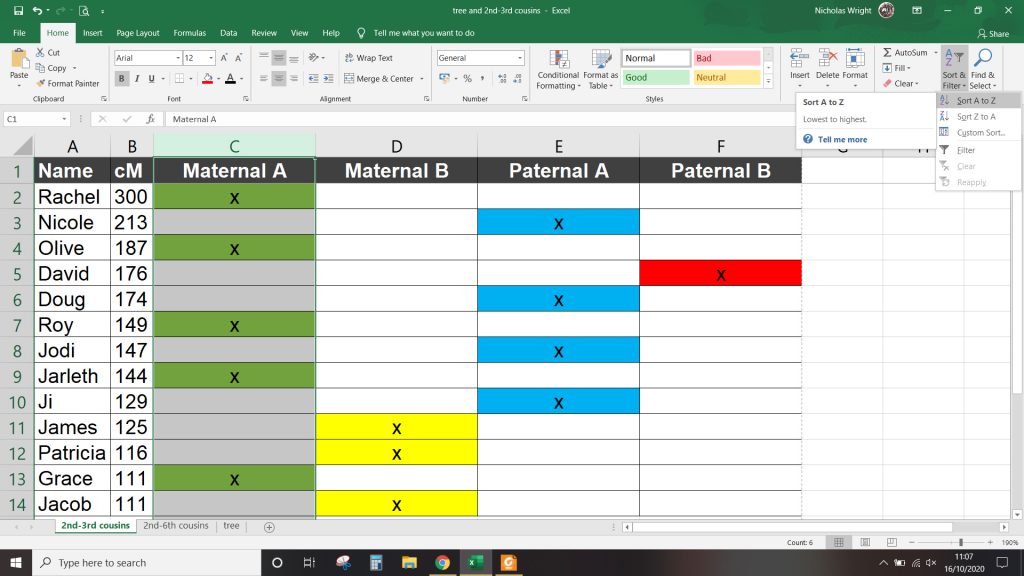
Using the sorting feature in Excel, it is also easy to group the clusters to show them more clearly.
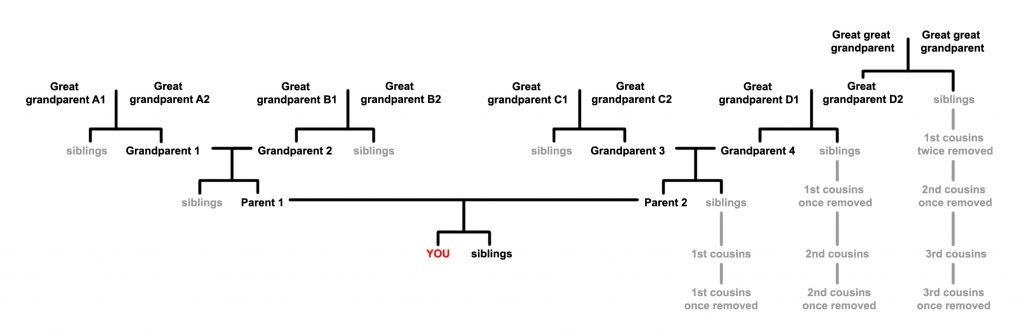
When working on Laura’s family tree, we now have additional cousins who we can fit into the maternal side of the family, as well as more leads to explore when seeking more information on the paternal side of the family. By looking at the centimorgans shared by each cousin, it is possible to look for likely relationships. The table below provides the average and range of shared cM for each relationship type.
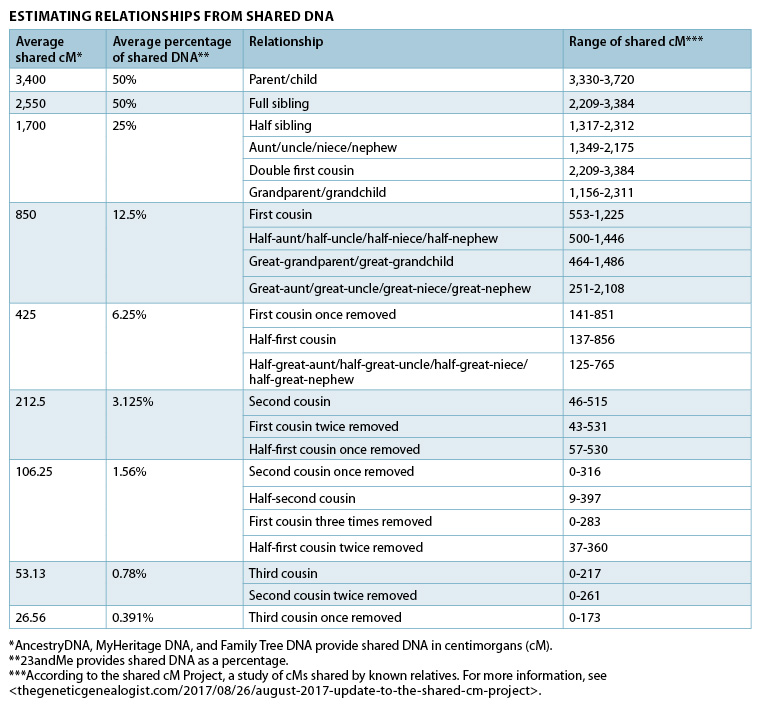
Estimating Relationships based on shared centimorgans, from https://www.familytreemagazine.com/
By looking at the possible ranges in the table above, Rachel (300cM) could be anything from Laura’s great aunt or great niece, a first cousin once removed, a half first cousin, a half great aunt etc, through to a second cousin once removed or a half second cousin. However, she is most likely a second cousin (i.e. the descendant of a grandparent’s sibling). As everybody has only four grandparents, the relationships potentially become much easier to negotiate.
According to the Leeds Method, if your results show less than four clusters, it is likely that the clusters represent only some of your four sets of great grandparents and that you have no matches at the second/third cousins levels who have tested for the remaining set of great grandparents.
If your results show four clusters but some of your matches have been assigned more than one color, your colour clusters likely show either your four sets of great grandparents, but also showing that some of these results are on one side of your family (maternal or paternal), or, the overlapped clusters might belong to just one set of great grandparents and you are missing matches for one set of your four sets of great grandparents. If there are lots of overlaps between clusters, it may also represent intermarriage between cousins resulting in pedigree collapse.
It is possible to use the same method to explore more distant cousins as you can see in the table below. In this example, we extended the the list of Laura’s cousins to include all those who shared 32cM or more (an arbitrary stopping point).
The names of people identified by AncestryDNA as Laura’s second or third cousins (i.e. those in the original set of colour clusters) are flagged in pink for easy identification. You can see that additional cousins have been added to all four of the previously identified clusters. However, eight additional ‘clusters’ were also revealed – most with only a single representative, and none of whom can be confidently linked to known branches of the participant’s family trees. Thus we see that while colour clustering is a very useful tool for structuring relationships with cousins who share between 100 and 400 cM, there is a clear limit to its practical use beyond that range.
Find out more about this project by clicking on the links below
Project background
Summary DNA results
Speaking of identity…
Unknown family members and DNA colour clustering
The skeleton in the closet
The advantages of a geographic DNA project
Genealogical research training videos
PRONI introductory video
Collections care training videos
Moyle Migrations booklet
For more information, or to get involved with this or future projects, contact Museum Services at cms@causewaycoastandglens.gov.uk